
Data
Analysis
The first exercise is an analysis of the recorded data from the EEG data, and a straightforward attempt at data visualisation in processing.
01: Datasets
The first step was to define the possible datasets into four different
sets of variables, then visualise them to be legible.
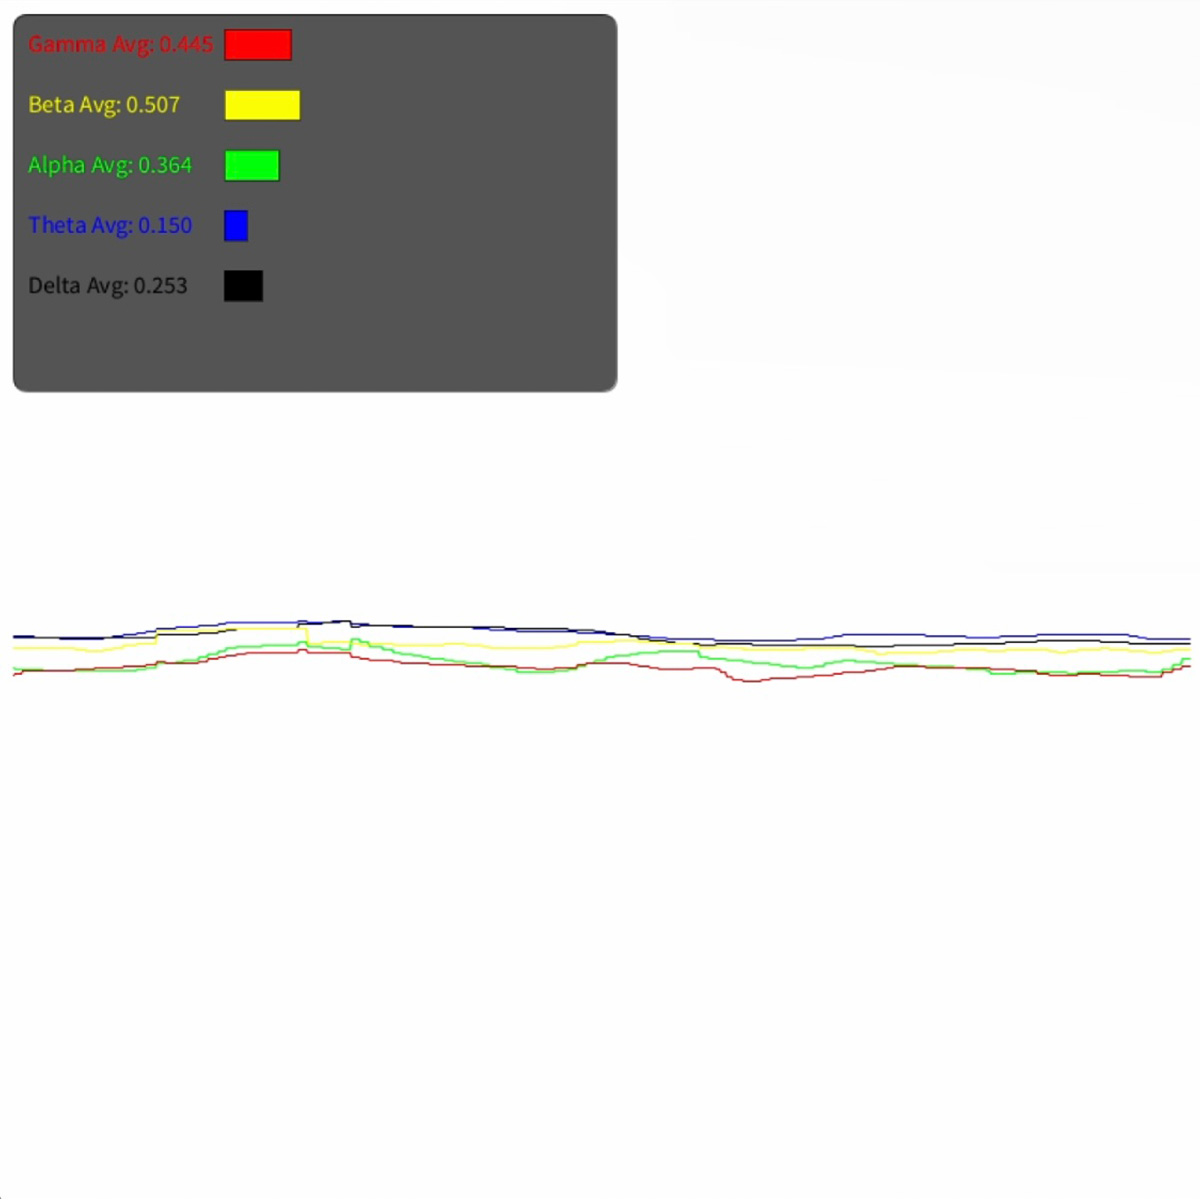
- Five Averages: Average for each five brain wave types—Alpha, Beta, Theta, Delta, and Gamma—which generalises brain wave activity.
- All: Absolute data give a total of 20 data points on region-specific brain activity, containing four floats for each type of brain wave.
Attempts at visualising all 20 region-specific data points and averages of the five brain waves in line graphs.
- Conscious: Absolute data of Alpha and Beta waves, selected for their variance in the conscious state.
- Subconscious: Absolute data of Theta and Alpha waves, selected for their representation of the subconscious state.
02: Data Analysis
A test recording of all 20 variables was done to analyse brain activity in 3 distinct states:
- State A: Focused (solving a rubik’s cube)
- State B: Meditating
- State C: Sleeping (light sleep)
To reduce noise, all states were recorded in the same position; lying down face up, even in state A.
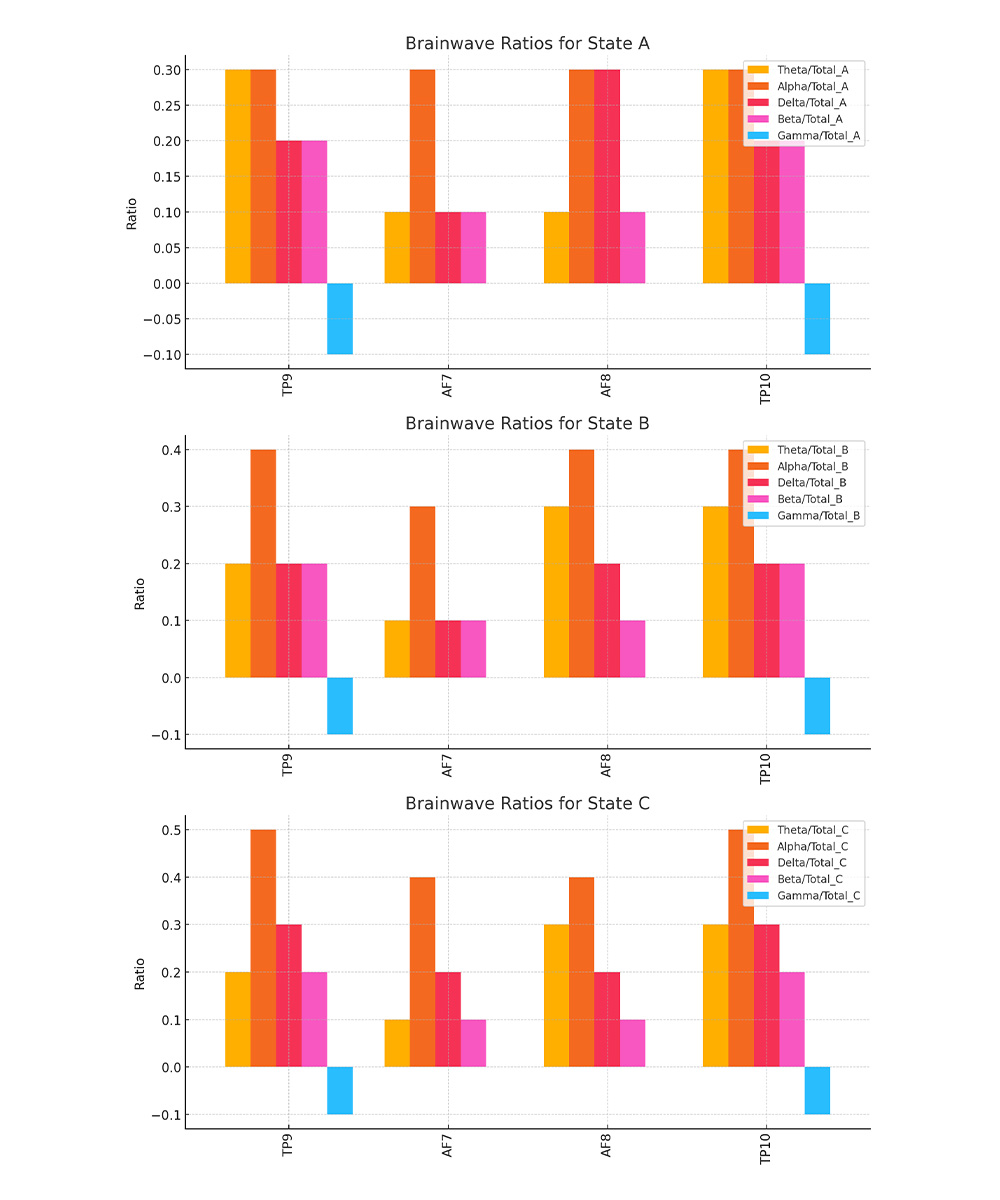
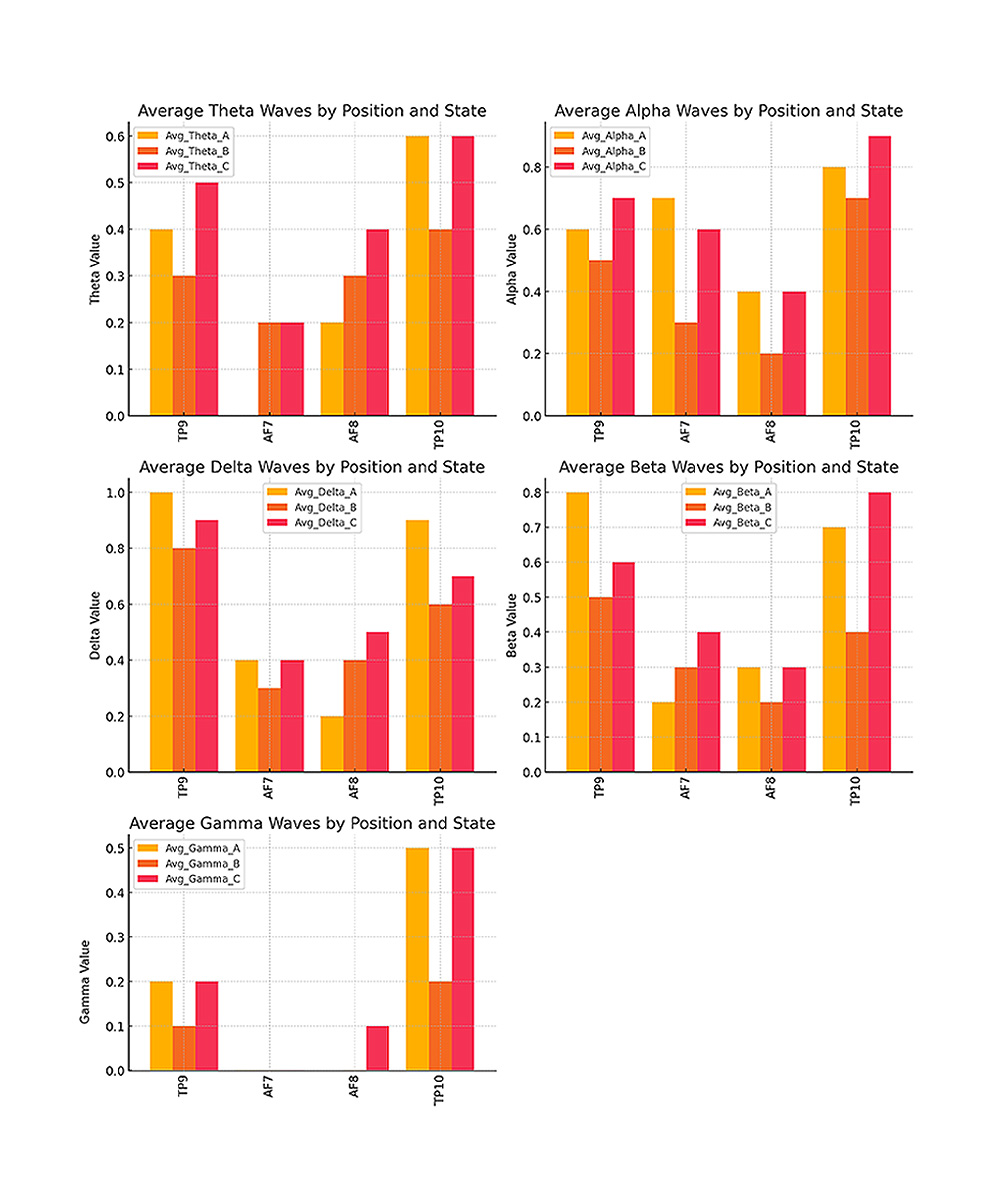
- State C: Most relaxed state, consistently high Theta and Alpha values across all electrodes.
- State B: Significant amount of relaxation, though not as pronounced as State C.
- State A: Moderate relaxation, with occasional dips in Theta and Alpha values.
- State A: Most balanced cognitive activity, moderate Beta and Gamma waves, suggesting active thinking.
- State B: Reduced cognitive activity compared to state A, especially in AF7 and AF8.
- State C: Lower focus on cognitive processing, Beta waves overshadowed by high Theta, Alpha, and Delta waves.
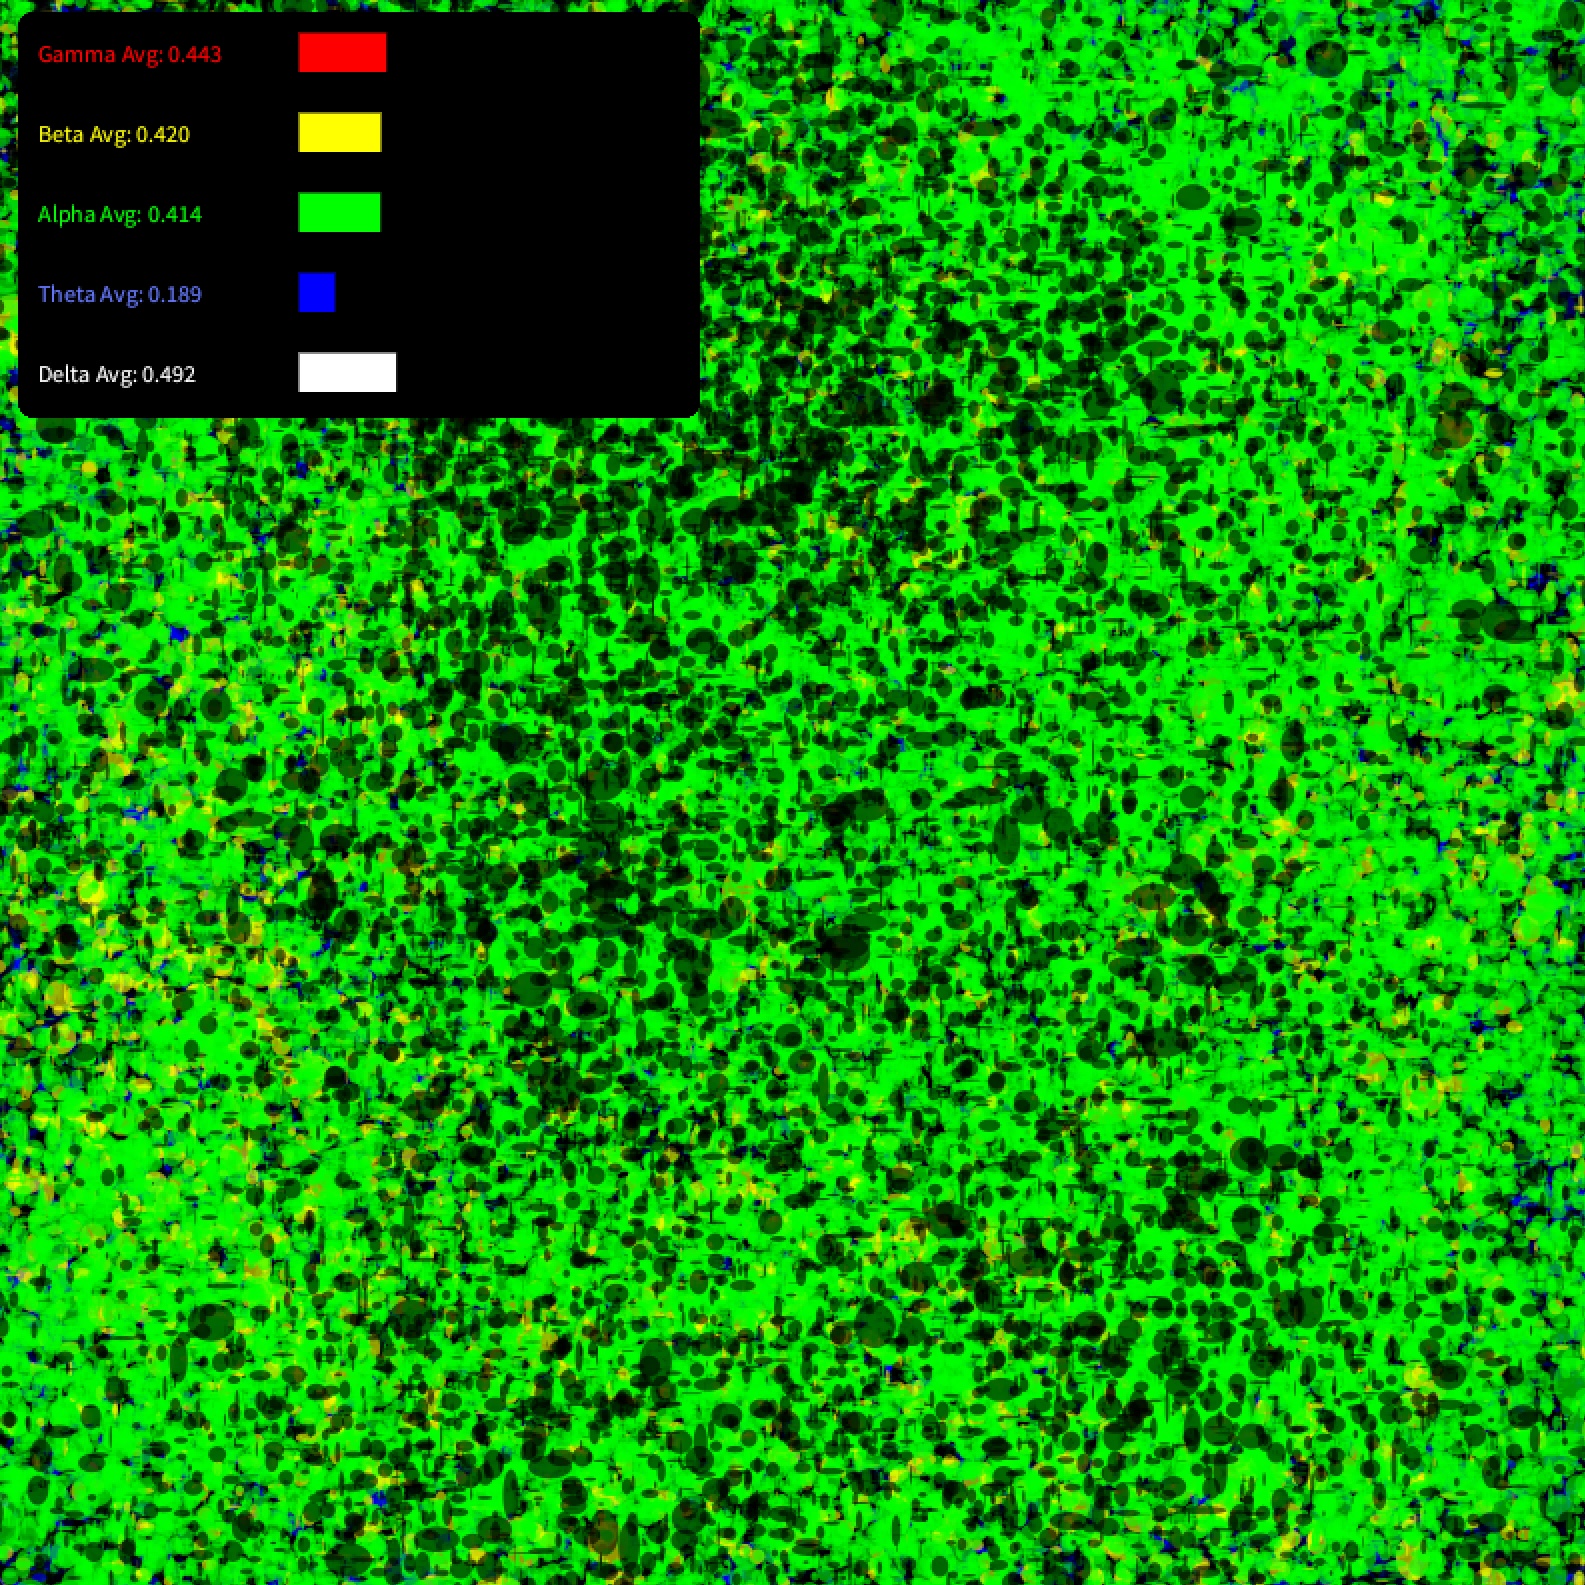
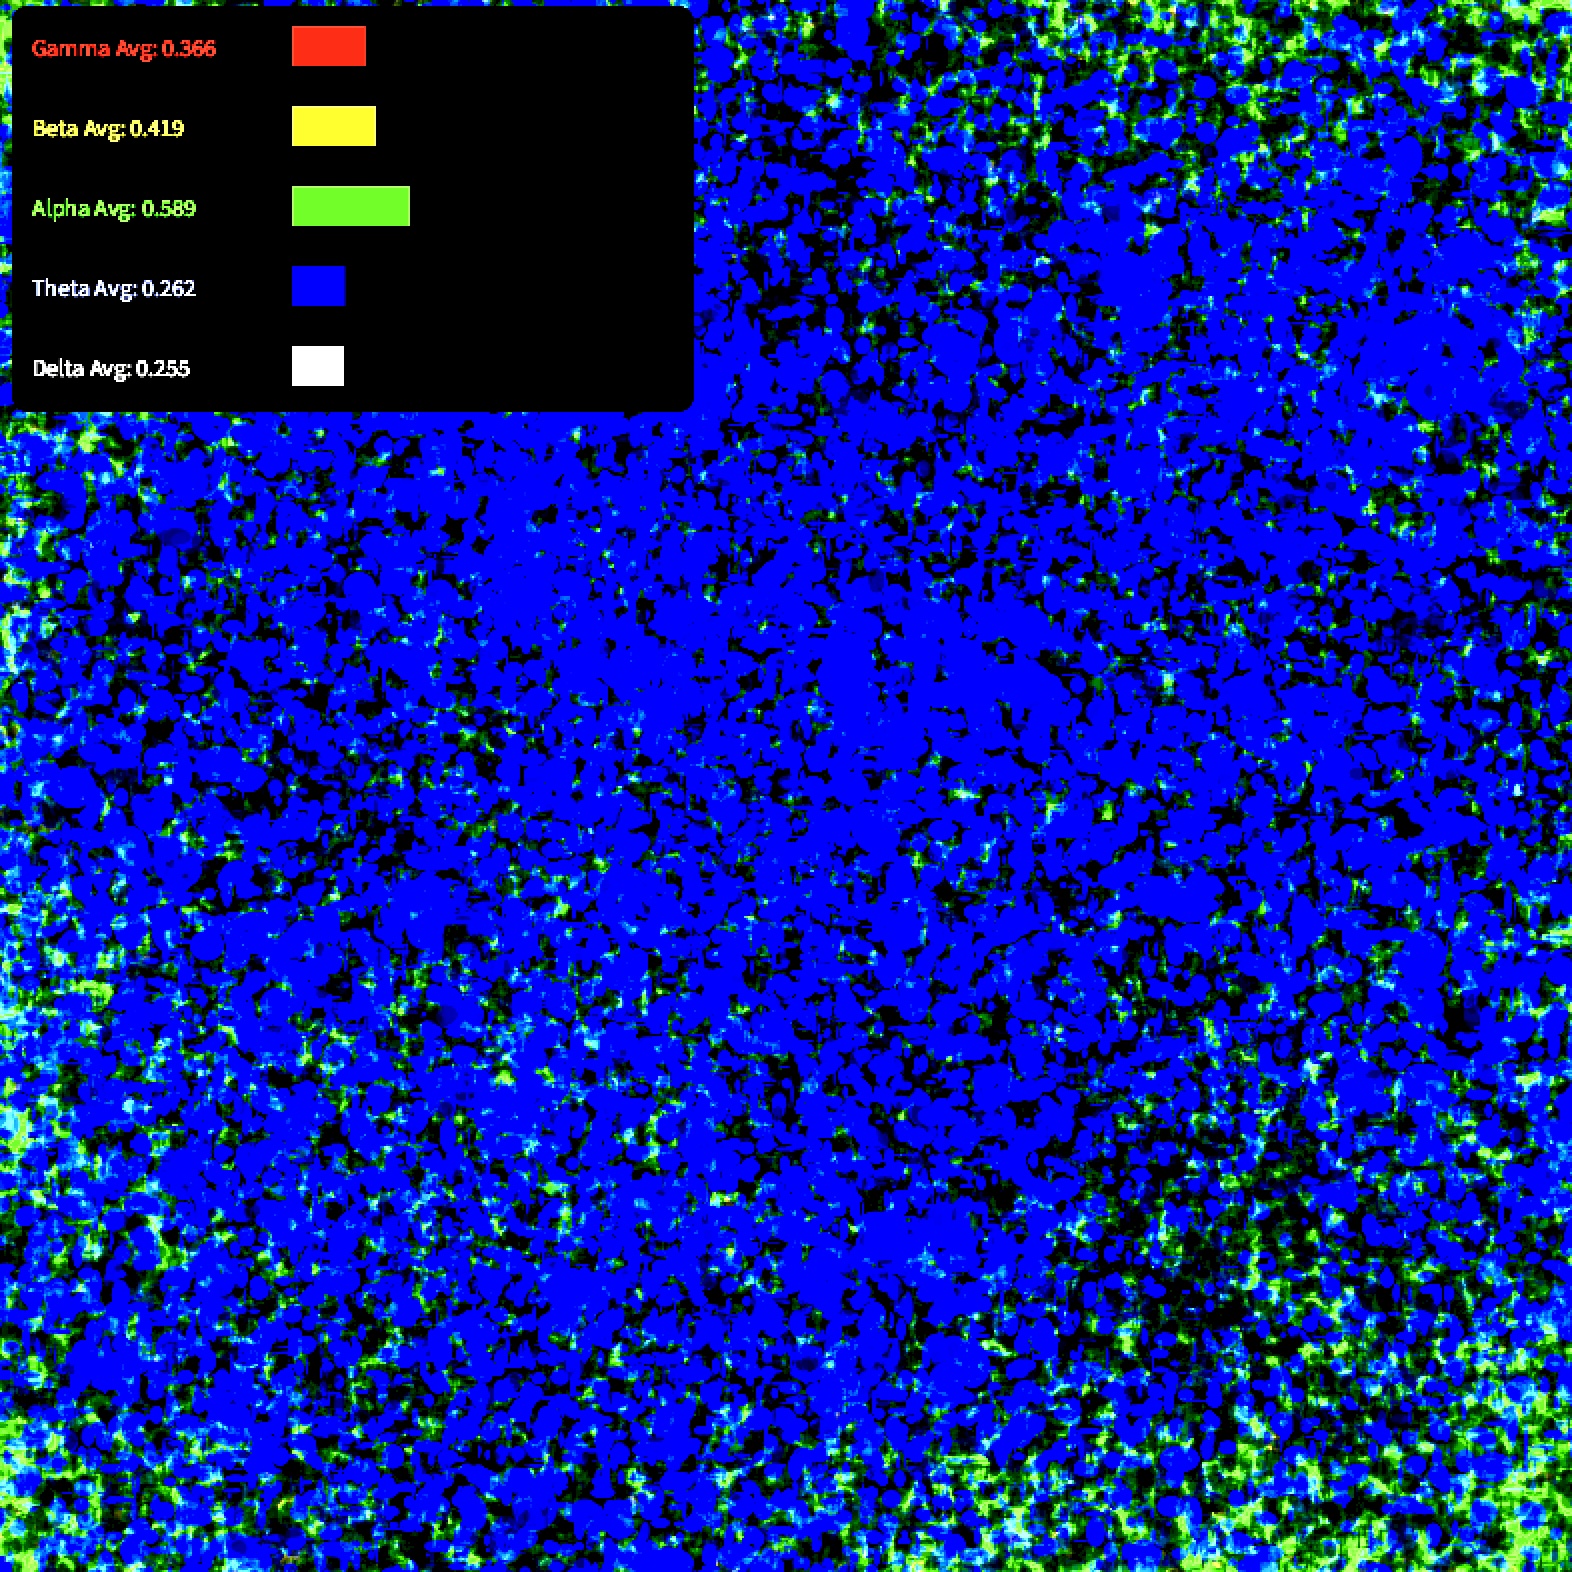
03: Data Visualisation
Attempts in creative data visualisation, with legibility as the main objective. A bar graph panel was introduced. This panel helps viewers understand how the visuals are responding to the data.