
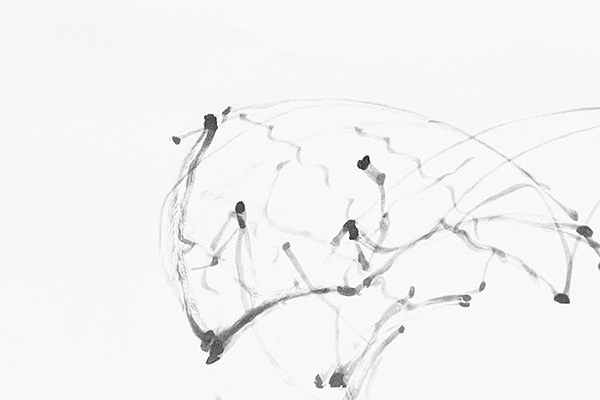
Audio Visuals
A projection of audio visuals from real time EEG data as input. The unpredictability of the brain's signals adds an element of involuntary control and serendipity.

01: 12 Tone Surrealism
Inspired by Arnold Schoenberg’s 12-tone serialism, this project adapts the compositional method to EEG-driven music. Serialism treats the 12 chromatic scale notes equally, avoiding traditional hierarchies like key centers. The technique’s tone rows, which can be reversed or inverted, provide a structure that feels almost mechanical, which I thought ideal for data-driven music generation.
This experiment reverses criticisms of serialism as overly algorithmic by embracing its structured approach to transform EEG data into music. This creates a system where brainwave inputs drive a mechanistic yet expressive composition process.
- Track A: Noise
- Track B: Melody
- Track C: Raindrops
- Track D: Beep
The experiments began with each EEG band controlling specific waveforms, such as alpha waves adjusting sine oscillator frequency and delta waves controlling white noise volume, resulting in an ambient soundscape that lacked melody. The second version introduced a C Major scale for melody, with theta waves controlling rhythm, alpha waves selecting notes, and gamma and beta waves adding a soothing bass layer, enhancing musicality while retaining simplicity.
Moving to 12-tone serialism in the third version replaced the scale, creating a surreal and abstract atmosphere with theta waves driving rhythm, alpha controlling melody, and delta contributing harmony. Finally, the fourth version focused on timbre customization, assigning distinct sounds to each band—flute-like tones for theta, bell-like tones for alpha, soft harmony for delta, and sporadic "raindrop" effects for gamma and beta—adding textural depth and dynamic variety to the auditory experience.
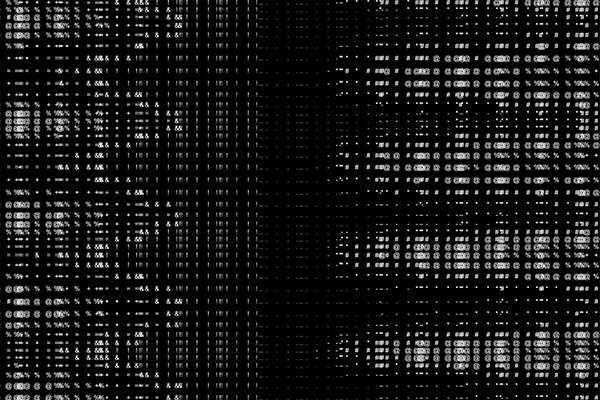
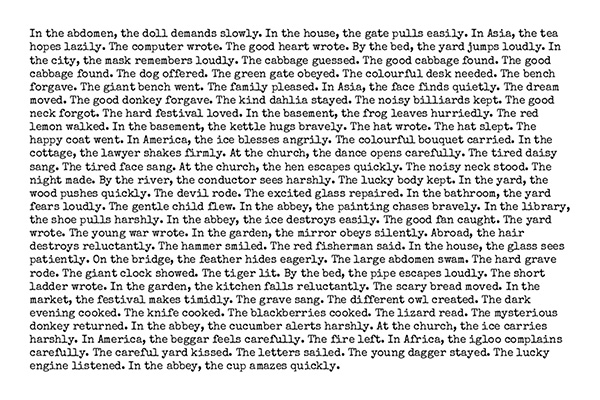
02: ASCII
Ascii Art from the EEG data, with track D.
The visualisation was inspired by binary, minimalist, and geometric aesthetics, leading to the use of ASCII animations as a structural reference. A grid of 120 columns and 60 rows serves as the canvas, where each cell carries a character selected based on theta, alpha, and gamma wave values processed through sine, cosine, and tangent calculations.
These layered waveforms create rippling patterns across the grid, visually reflecting the fluidity of EEG data. Additional movement comes from subtle shifts in character positions, influenced by theta and delta waves, which nudge the characters along the x and y axes, mimicking changes in kerning and line height. This motion adds depth and a tactile quality to the display, enhancing its dynamic, modular appearance.
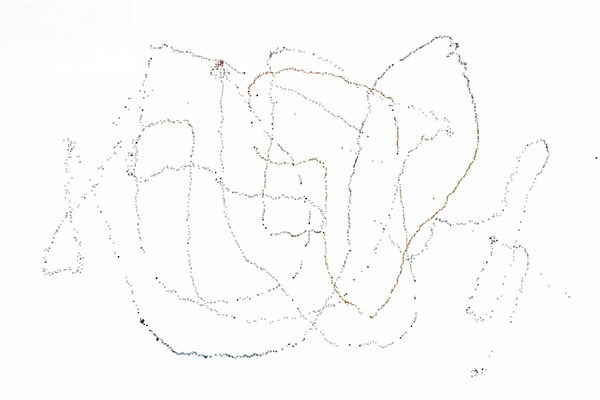
03: Binary Patterns
Following the feedback, the second visual experiment tried to be more intuitively readable for the user.
These layered waveforms create rippling patterns across the grid, visually reflecting the fluidity of EEG data. Additional movement comes from subtle shifts in character positions, influenced by theta and delta waves, which nudge the characters along the x and y axes, mimicking changes in kerning and line height. This motion adds depth and a tactile quality to the display, enhancing its dynamic, modular appearance.